Climate Monitoring and Assessment
Continually monitor and assess the trends and likely impacts of changing climatic and sea level conditions on the Chesapeake Bay ecosystem, including the effectiveness of restoration and protection policies, programs and projects.
Progress
Recent Progress: Increase
The Chesapeake Bay is one of the most vulnerable regions in the nation to the impacts of climate change. In 2018, the partnership adopted five indicators to track the impact of changing climatic conditions on the physical environment. In 2021, the Management Board and the Climate Resiliency Workgroup prioritized these indicators with Average Air Temperature Increases and Total Annual Precipitation Change to be updated regularly. The Stream Temperature Change, Relative Sea Level Rise, Change in High Temperature Extremes and River Flood Magnitude and Frequency indicators will be refined to better connect with the natural resource outcomes and community resilience before they are updated further. Bay Water Temperature Change was added as a new climate change indicator to develop. Monitoring and assessing patterns and trends from these indicators will increase our ability to track environmental changes, protect the Bay’s natural resources and improve policies, programs and projects through adaptive management. For instance, changes in air temperature influence water temperatures, which affect the abundance, composition and distribution of underwater grasses as well as tidal fisheries and the stream habitat available to brook trout.
Recent progress toward the Climate Monitoring and Assessment outcome has increased with updated data on air temperature and annual precipitation change within the Bay watershed. The Climate Resiliency Workgroup and partners use these indicators to characterize regional trends, which help guide discussions on adaptation strategies to enhance the resiliency of Chesapeake Bay to climate change impacts.
In 2022, multiple goal implementation teams worked together with guidance from the Scientific and Technical Advisory Committee (STAC) to discuss the effects of rising water temperatures on living resources and habitats. Workshop participants discussed the state of the science around rising water temperature’s impacts on living resources and habitats, identified management implications, developed management recommendations, and determined associated science needs to address the rising water temperatures in the tidal and nontidal waters of the Bay. The resulting STAC Rising Water Temperatures report is an important source of scientific information to guide our work. Recommendations from the report are also being used to inform the development of a Bay Water Temperature Change indicator.
The Climate Resiliency Workgroup also collaborated with the Water Quality Goal Implementation Team, Modeling Workgroup and the Urban Stormwater Workgroup in supporting Virginia Tech’s review of water quality best management practices (BMPs) related to reducing nutrients and suspended sediment and their performance uncertainties due to climate change impacts. This review is supporting efforts to develop a research agenda on how to improve the resilience of BMPs to changing climate conditions.
Outlook: On Course
The outlook of this outcome is on course as progress continues for assessing climate change trends related to physical change (e.g., temperature, precipitation, sea level rise). The Chesapeake Bay Program has developed water temperature trend-based recommendations related to restoration and protection policies and programs found in the STAC Rising Water Temperatures report. To stay on course, these recommendations need to be reviewed and implemented by their respective partner programs (e.g., natural resource agencies, federal agencies, local governments). The Climate Resiliency Workgroup supports efforts to connect partners to make progress on these recommendations.
While on course, the Climate Resiliency Workgroup has experienced resource constraints that affect their ability to update and develop climate change indicators. Currently, the Climate Resiliency Workgroup is seeking data providers, cross-outcome collaborative opportunities and resources to support indicator development, which are integral to remain on course.
Current Indicators
These indicators are updated every one to three years as new data are made available.
Average Air Temperature Increases in the Chesapeake Bay Watershed (1901-2021)
Air Temperature Change
According to data from the National Oceanic and Atmospheric Administration (NOAA), air temperature across the Chesapeake Bay watershed has increased over the last 100 years. In 2021, all 33 of the climate divisions located within the watershed have experienced statistically significant increases in average air temperature when compared to the baseline time period from 1901-2000. This is an increase from 2017, when 32 of the climate divisions showed statistically significant increases. Rates of increase range from 0.6°F per century in southern West Virginia to more than 2.8°F per century in Delaware. This is higher than 2017’s range of 0.4 degrees Fahrenheit per century to about 2.5 degrees Fahrenheit per century. Climate divisions closer to the Bay have warmed more than regions farther upstream in the watershed.
Change in Total Annual Precipitation in the Chesapeake Bay Watershed (1901-2021)
Annual Precipitation Change
According to data from NOAA, annual precipitation totals in some parts of the Chesapeake Bay watershed have increased over the last 100 years. In 2021, of the 33 climate divisions located within the Chesapeake Bay watershed, 32 experienced an increase in total annual precipitation change compared to a baseline period from 1901-2000. In 2021, percent changes in total annual precipitation from the 100 year baseline range from -0.203% in southern West Virginia to 17.62% in central New York. This varies from 2017, where percent changes range from -4.04% in southern West Virginia to 15.97% in central New York. As climate change alters air circulation patterns across the region and around the world, annual precipitation rates will rise in some areas and fall in others. Sixteen climate divisions, mostly in New York and parts of Pennsylvania, have shown statistically significant increases, up from only seven divisions in 2017. Consistent with 2017, the southwestern region of the watershed shows the least precipitation change.
Indicators Under Refinement or Development
Refinement of these indicators is currently being assessed with partner Chesapeake Bay Program workgroups to better align with ecological and community impacts and will be updated when new methodologies are developed.
Change in High Temperature Extremes in the Chesapeake Bay Watershed (1948-2017)
High Air Temperature Extremes
In some parts of the country, climate change is causing more frequent high temperature extremes. While there is more than one way to define a high temperature extreme, the Chesapeake Bay Program considers an unusually hot day to be one on which the maximum temperature observed at a particular weather station is among the top five percent of daily highs observed at that weather station across all years of measurement. As of 2017, in the watershed, only one weather station has experienced a statistically significant increase in high temperature extremes since 1948.
In contrast, a “tropical nights” analysis—which examines trends in nighttime lows rather than daytime highs—does show a clear warming trend in the region. High nighttime temperatures are often linked to a heat wave’s more serious impacts on human health.
The refinement strategy of this indicator could include connecting it with urban communities that are underserved and/or under resourced in relation to shading benefits of tree canopy.
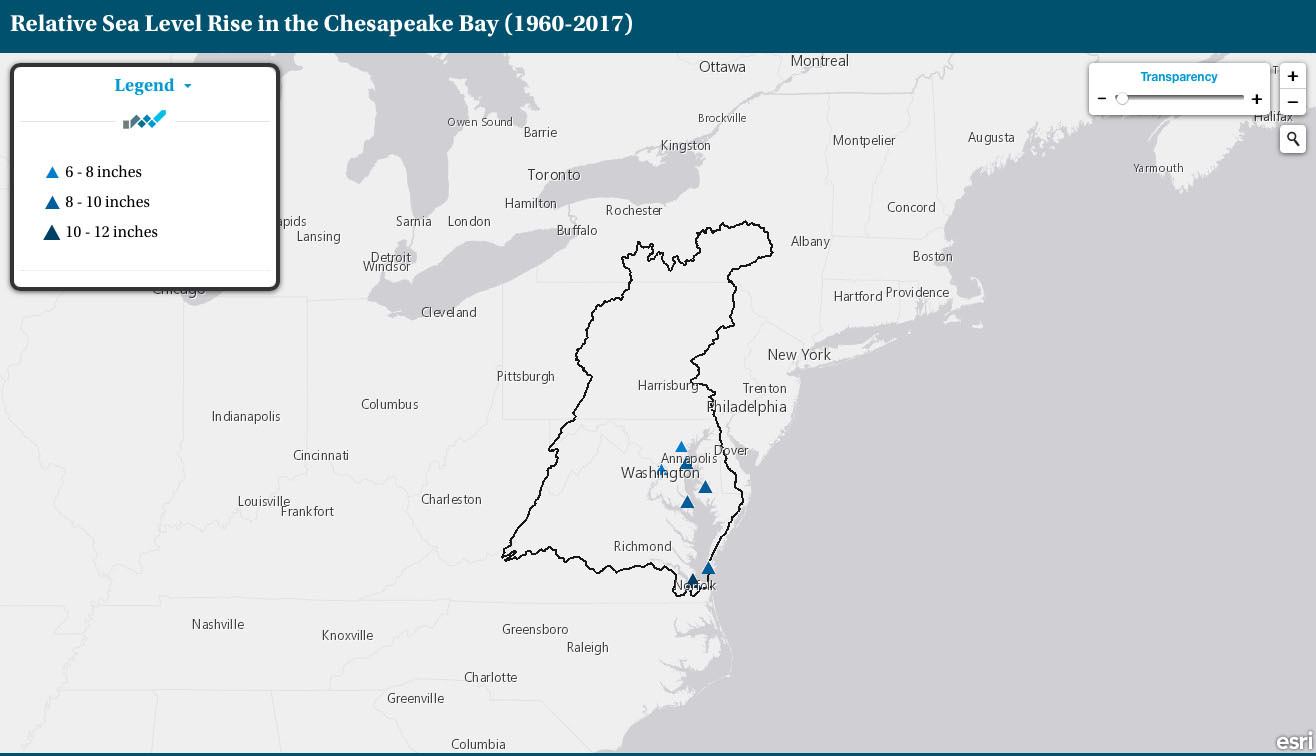
Relative Sea Level Rise in the Chesapeake Bay (1960-2017)
Sea Level Rise
According to data from NOAA, as of 2017, relative sea level has risen at each of the seven long-term tide gauge stations on the Chesapeake Bay and its tributaries. Between 1960 and 2017, sea level has increased between one-eighth of an inch and approximately one-sixth of an inch each year.
Total increases in sea level at these seven tide gauge stations range from seven inches in Baltimore to more than 10 inches (taller than the length of the average pencil) in Norfolk, Virginia. Regionally, relative sea level rise is compounded by the natural sinking of the land’s surface, known as subsidence. Locally, it can be exacerbated by the human extraction of groundwater.
The refinement strategy of this indicator could include spatially connecting it with relative sea level rise trends in relation to tidal marsh area and migration corridors.
Stream Temperature Change in the Chesapeake Bay Watershed (1960-2014)
Stream Temperature
According to data from the U.S. Geological Survey (USGS) from 1960-2014, average annual stream temperature in the Chesapeake Bay watershed has increased by 1.1 degrees Fahrenheit over the past six decades.
Seventy-nine percent of the 72 stream sites monitored between 1960 and 2014 experienced an increase in water temperature. Of these increases, more than half are considered statistically significant trends. At these sites, stream temperature has increased by an average of 2.1 degrees Fahrenheit.
In general, the largest increases in stream temperature have occurred in the southern part of the watershed.
The refinement strategy of this indicator could include connecting it with stream health and identifying resilient brook trout habitat.
River Flood Frequency in the Chesapeake Bay Watershed (1965-2015)
River Flood Magnitude in the Chesapeake Bay Watershed (1965-2015)
River Flood Frequency and Magnitude
According to data from USGS from 1965-2015, river flooding in the Chesapeake Bay watershed has grown larger and more frequent over the past 50 years. Between 1965 and 2015, 72 percent of 47 stream sites in Delaware, Maryland, Pennsylvania, Virginia and West Virginia experienced an increase in the size of river floods. Seventy-one percent of stream sites experienced an increase in the frequency of river floods. Because most of these stream sites experienced variation in flood size and frequency from year to year, experts do not consider these trends to be statistically significant.
While flood size and frequency can be impacted by site-specific and regional factors, climate change has been linked to more extreme precipitation events. Experts anticipate more frequent and more extreme precipitation events to generate larger and more frequent upstream floods.
The Climate Resiliency Workgroup is currently looking for data providers for a flooding indicator that draws connections to community resilience.
Bay Water Temperature Change
The Climate Resiliency Workgroup is exploring development of an indicator that connects tidal water temperature change with water quality thresholds to assess habitat suitability for fish and submerged aquatic vegetation (SAV) to inform adaptive management decisions. Recent efforts towards development of this indicator include discussions of utility, methodology and implementation at the two-day STAC workshop titled “Rising Watershed and Bay Water Temperatures – Ecological Implications and Management Responses,” which took place in January and March of 2022. Additional efforts include collaborating with the Integrated Trends Analysis Team (ITAT) at the Chesapeake Bay Program. The ITAT’s efforts include tracking surface water temperature trends throughout the Bay in both the short- and long-term timeframes.
Potential Indicators
In 2018, Eastern Research Group, Inc., (ERG) worked with the Chesapeake Bay Program to develop an implementation strategy that defines and describes the steps and resources needed to create various climate change-related indicators. As partnership priorities evolve and new sources and methods of analyzing data emerge, the Chesapeake Bay Program may choose to change its course or implement certain indicators from this suite. Further development of these indicators will depend on the quality of supporting data, the benefit of the indicators in question and the priorities and resources of the Climate Resiliency Workgroup and the Chesapeake Bay Program.
Additional indicators of climate change related to physical stressors may include
- Changes in the acidity of the Bay and its tidal tributaries.
- Extreme precipitation events.
- Shoreline condition.
Additional indicators of climate change related to ecological impacts may include
- The change in abundance of harmful algal blooms.
- The spatial extent and ability of wetlands to act as a physical buffer.
- The spatial distribution of select climate-sensitive bird species.
- The spatial distribution of select climate-sensitive fish species.
- The change in community composition of underwater grasses in the Chesapeake Bay.
Additional indicators of climate change related to social conditions may include
- The frequency of tidal flooding in coastal cities.
- The extent of developed land located within a floodplain or storm surge risk zone and the estimated property damage caused by flooding and storm events.
Management Strategy
To achieve this outcome, Chesapeake Bay Program partners have committed to:
- Defining goals and establishing baselines for the monitoring, modeling and assessment of different aspects of climate change.
- Identifying and prioritizing gaps in available assessment tools, scientific understanding and baseline monitoring.
- Assessing climatic trends, documenting observed changes and supporting climate vulnerability assessments of the Chesapeake Bay ecosystem.
- Identify science needs and support effort to develop research agendas.
- Reassessing priorities and revising goals.
As part of the Chesapeake Bay Program’s partnership-wide implementation of adaptive management, progress toward this outcome was reviewed and discussed by the Management Board in November of 2022.
Logic & Action Plan
Chesapeake Bay Program partners have committed to taking a series of specific actions that will support the management approaches listed above.
Ongoing
- Having cross-workgroup discussions to identify case studies and examples to assist and inform how living resources can be incorporated into the development of a Bay Water Temperature Change indicator.
- Developing a stream temperature indicator related to climate resilience factors of interest (e.g., forest cover, brook trout habitat) in collaboration with the Healthy Watersheds Goal Implementation Team, Stream Health Workgroup and Forestry Workgroup.
- Discussing methods to quantify current and projected coastal wetland losses from sea level rise and wetland gains from marsh migration in collaboration with the Wetland Workgroup, Land Use Workgroup and Status and Trends Workgroup.
- Providing advisory support to the Modeling Workgroup and Water Quality GIT on the application of the Total Maximum Daily Load (TMDL) climate change model projections and any updates for 2025.
- Having discussions, in collaboration with the Scientific, Technical, Assessment and Reporting (STAR) team to plan a potential aquatic resource sentinel site monitoring program for nearshore habitats by identifying ecosystem, species, and environmental parameters; partners; sampling protocols; needed resources; and optimal sites.
Recently Completed Actions
2023
- Released, with STAC, the Rising Water Temperatures report.
2021-2022
- Held a STAC Workshop, “Rising Watershed and Bay Water Temperatures—Ecological Implications for Ecosystem Processes Influencing Stream, River, and Estuarine Health
- Compiled water temperature data sources and hosted cross-workgroup discussions on the utility of water temperature change indicators in connection to fisheries and habitats.
- Explored the use of the synthesis product to inform decision making for coastal adaptation in conjunction with the Habitat Goal Implementation Team’s FY20 GIT-funding project, “Synthesizing Shoreline, Sea Level Rise and Marsh Migration Data to Inform Wetland Restoration Targeting.”
- In collaboration with Virginia Tech, published a systematic literature review of climate change impacts and uncertainties related to Best Management Practice reduction of nutrients and suspended sediment (focused on urban, agricultural and natural BMPs).
- Developed, with the Urban Stormwater Workgroup, future projected Intensity, Duration and Frequency (IDF) curves and a web-based tool for the entire Chesapeake Bay watershed and Virginia. This incorporates multiple downscaled climate model data sets to compute IDF curve change factors to inform stormwater management design under changing precipitation.
- Incorporated climate change considerations and projections into the TMDL Model framework. The modeled outputs provide insights into climate change effects on nutrient and suspended sediment loads in the Bay as well as information on how to accommodate the projected changes. The jurisdictions used these outputs in the development of their Phase III Watershed Implementation Plans beginning in 2021.
Participating Partners
The Climate Resiliency Workgroup leads the effort to achieve this outcome. It works in partnership with the Sustainable Fisheries, Habitat, Water Quality and Healthy Watersheds goal implementation teams.
Participating partners include the following:
- Alliance for the Chesapeake Bay
- Bucknell University
- Chesapeake Research Consortium
- Christopher Newport University
- College of William and Mary (Commonwealth of Virginia)
- District of Columbia
- Ecosystem Planning and Restoration
- Hampton Roads Planning District Commission (Commonwealth of Virginia)
- Howard County Environmental Sustainability Board Resiliency Subcommittee
- Maryland Sea Grant
- Maryland Department of Planning
- Maryland Department of Natural Resources
- Maryland Department of Transportation
- Maryland Department of the Environment
- Metropolitan Washington Council of Governments
- Morgan State University (State of Maryland)
- National Oceanic and Atmospheric Administration
- National Wildlife Federation
- New York State Department of Environmental Conservation
- NOAA Mid-Atlantic Regional Integrated Sciences and Assessments
- Northern Virginia Regional Commission
- Old Dominion University (Commonwealth of Virginia)
- Pennsylvania State University
- Polytechnic Institute and State University (Commonwealth of Virginia)
- Rand Corporation
- Sierra Club
- State of Delaware
- State of West Virginia
- Tetra Tech
- The Chesapeake Bay Commission
- The Conservation Fund
- The Nature Conservancy
- University of Delaware Cooperative Extension (State of Delaware)
- University of Maryland (State of Maryland)
- U.S. Army Corps of Engineers
- U.S. Department of the Navy
- U.S. Environmental Protection Agency
- U.S. Fish and Wildlife Service
- U.S. Forest Service
- U.S. Geological Survey
- Virginia Agribusiness Council
- Virginia Institute of Marine Science (Commonwealth of Virginia)
- Virginia Sea Grant Land Trust Alliance
- Wetlands Watch